> For the complete documentation index, see [llms.txt](https://docs.overdare.com/llms.txt). Markdown versions of documentation pages are available by appending `.md` to page URLs; this page is available as [Markdown](https://docs.overdare.com/manual/script-manual/debugging-and-optimization/breakpoint.md).
# Breakpoint
## Overview
The **Breakpoint** function is a script debugging tool that allows you to pause the execution of a script at a specific point to examine the state of that point or analyze any issues during the script’s execution.
When a breakpoint is hit, you can check the current execution status through debugging panels such as **Watch and Call Stack** and step through the code for further analysis.
## How to Use
### 1. Setting a Breakpoint in the Script Editor
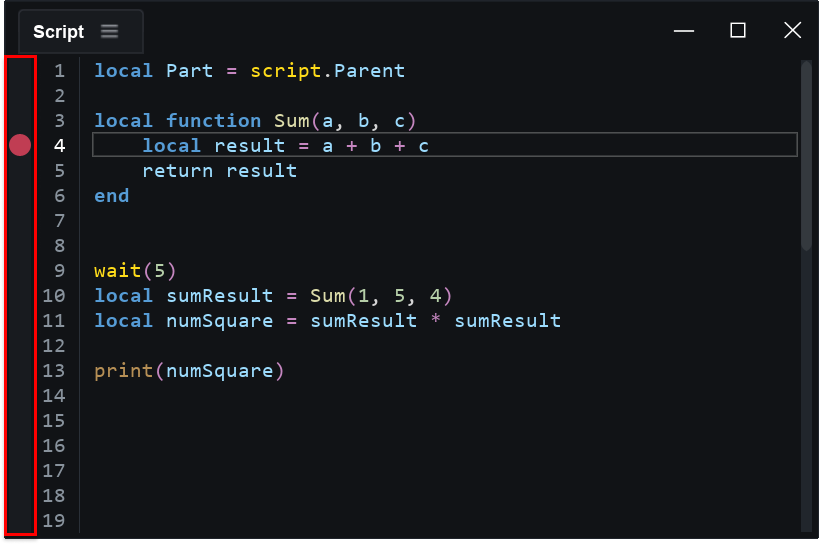
Open the script that requires debugging, find the line of code where you want to set the breakpoint, and click on the **horizontal bar to the left of the line number** to create a breakpoint.
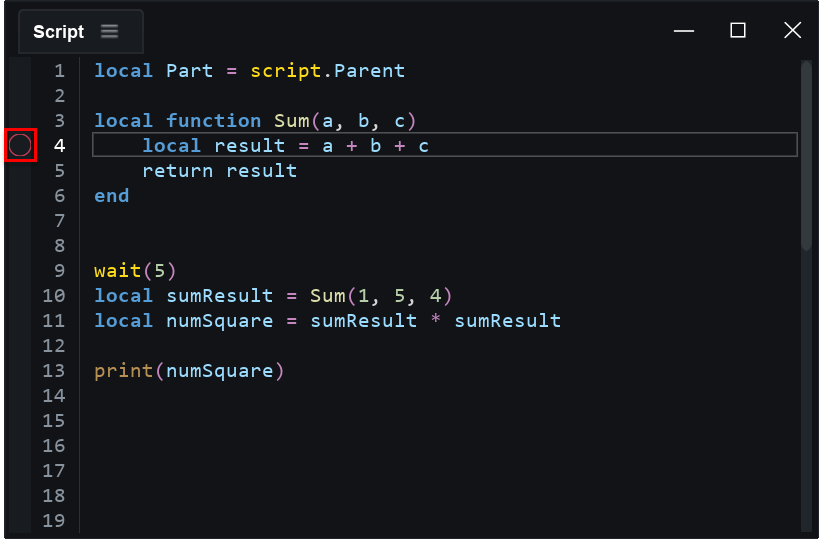
When a breakpoint is created, a red circle (🔴) appears. You can deactivate it by clicking the circle again (⭕).
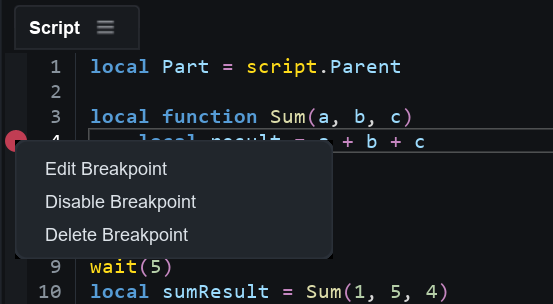
You can edit a breakpoint by right-clicking on it and then pressing each function in the menu.
* Edit Breakpoint: Set breakpoint condition
* Disable Breakpoint: Disable breakpoint
* Delete Breakpoint: Delete breakpoint
### 2. Execute the line of code with the breakpoint set in the test play.
Run a test play, then set the game so that the **code line with the breakpoint** is executed.
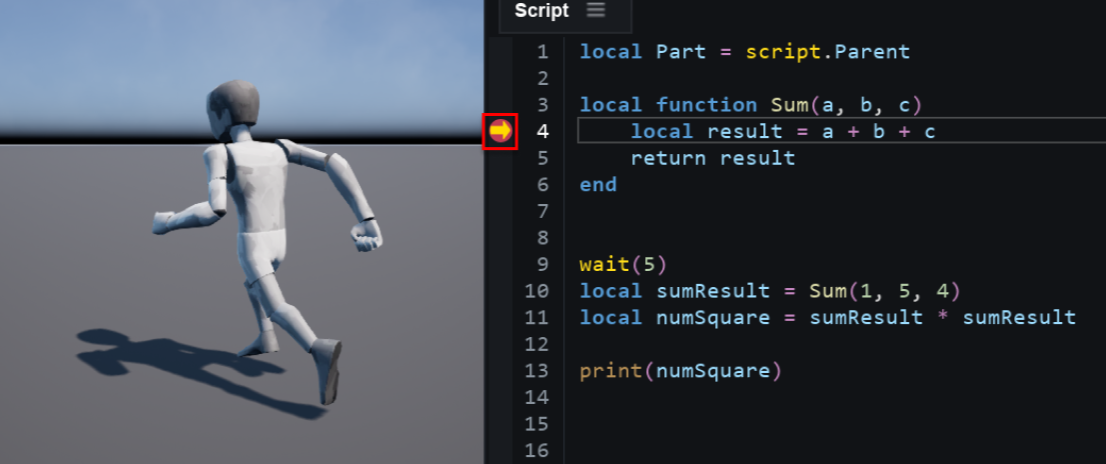
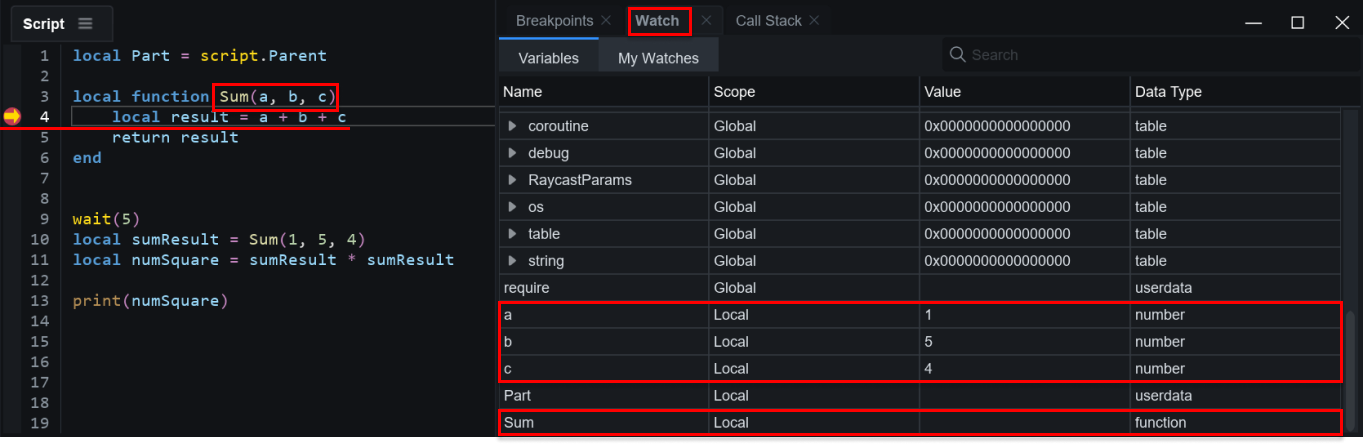
When the line of code where the breakpoint is set is executed (the breakpoint is hit), the game stops and an **arrow (➡)** is displayed on the line of the hit breakpoint. In this state, you can analyze the Call Stack or Watch.
### 3. Watch Analysis
In the Watch tab, you can check the current state, such as the values of variables or tracking specific variables.
### 4. Call Stack Analysis
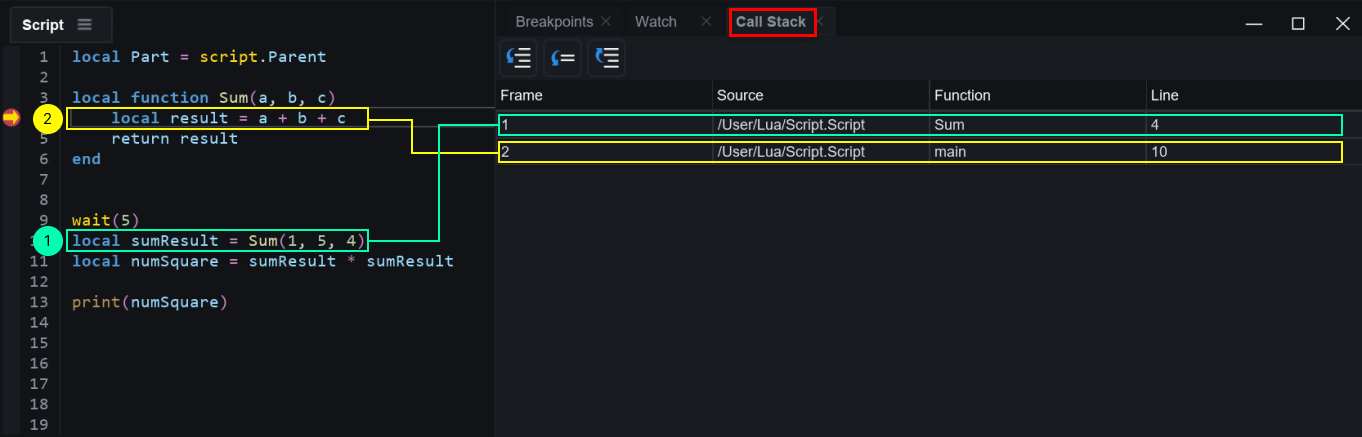
In the Call Stack tab, you can check the flow of code calls.
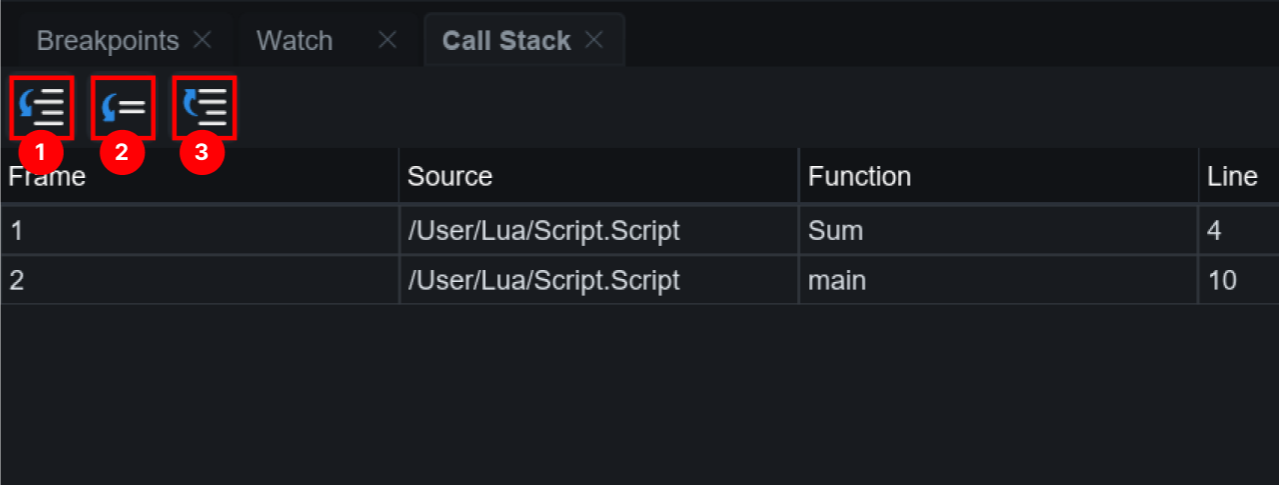
By clicking the button at the top of the Call Stack tab, you can exit the hit breakpoint to move to the next one or resume the paused game.
* 1️⃣ Step Into: Enter the **function** on the current line and continue debugging.
* 2️⃣ Step Over: Execute the function on the current line **without entering it, then move to the next line**
* 3️⃣ Step Out: Execute the rest of the current function and return to the **parent function**.
### 5. Breakpoint Bulk Editing
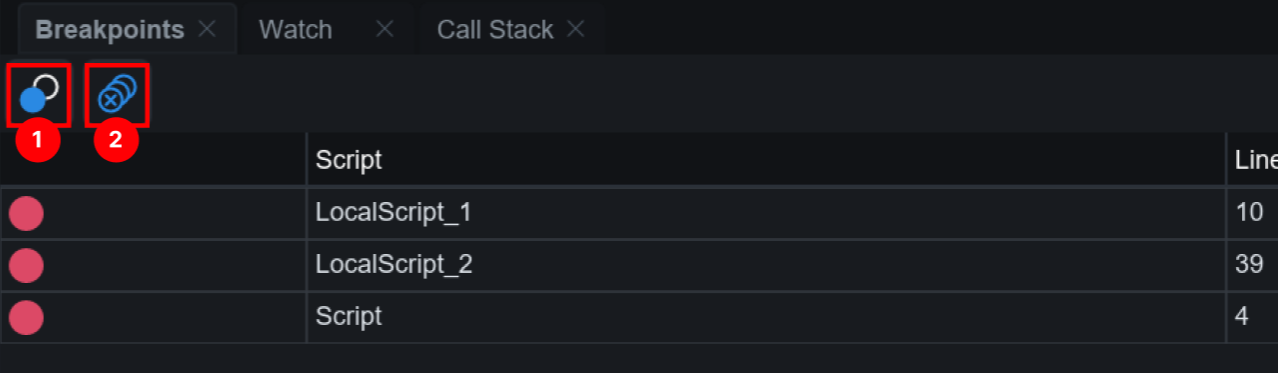
If breakpoints are set in multiple scripts, you can view the entire list in the Breakpoints tab without opening each script. You can also enable/disable or delete all breakpoints by clicking the buttons at the top of the Breakpoints tab.
* 1️⃣ Disable All Breakpoints : Enable/disable all breakpoints
* 1️⃣ Delete All Breakpoints : Delete all breakpoints
### 6. Issues and Solutions
Based on the Call Stack and Watch information, you can effectively analyze issues during debugging by checking the value of a specific variable, tracking changes in object properties, unexpected function calls, and unintended code flow.
## Usage Example
Breakpoints are a highly effective tool for identifying and fixing issues in your code. For example, if the code calculating the cumulative sum in a loop produces unexpected results, you can use the Watch tab to track the variable’s values. This will help you quickly spot errors such as incorrect initial values or mistakes in the calculation formula.
The Call Stack tab is also useful for tracing the order of function calls and understanding the execution path of your code. For example, if a particular function is called with unexpected values or if the call order is off, you can check the Call Stack to pinpoint the root cause of the issue.
By effectively utilizing debugging tools, you can systematically analyze variable states, function call flows, and the logic of your code, which can significantly **speed up problem-solving**.